In its steepest decline since its inception in 1975, the
URA property price index plunged a hefty 14.1% in Q1 this year.
The
URA property index tracks private home prices in Singapore.
The apparent recovery triggered by the strong sales of Alexis and Caspian condominiums in February was just a mirage.
As
predicted by Salary.sg in October last year, the
URA index has dropped more than 20% since it began easing 3 quarters back.
With the same
technique used last year, I overlay the
URA price index
chart over the Straits Times Index graph (dark blue), adjust the scales of both graphs, and voila, this is what I get:
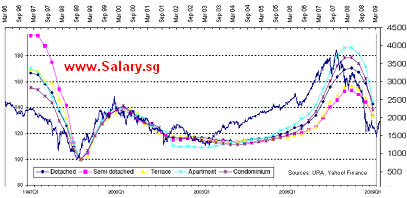
The peaks and bottoms of both graphs meet at the same levels, but property lags stocks by a few months.
It's not hard to see that property will drop further in the coming quarters.
References:
URA news release of Q1 real estate statistics (April 24, 2009),
Private home prices fall (ST, April 24, 2009)
http://www.salary.sg/2009/property-p...hed-see-graph/